
About kWh (4 kWp)
- June
- 474
- July
- 479
- December
- 136
- January
- 156
- Whole year
- 3,942
Milton Keynes · Bletchley · Wolverton · Stony Stratford · Bradwell
Solar panels, batteries and EV chargers for homes in and around Milton Keynes, with the city’s leases, conservation areas and network paperwork set out plainly.
HIES Consumer Code member · NAPIT registered · MCS certified · Trustpilot reviewed
Our Buckinghamshire coverage is, for now, one city: Milton Keynes, designated a New Town on 23 January 1967 and a city since 2022. It has its own city council, and every local figure on this page is for that council’s area. We have not yet researched the county’s other towns to the same standard, so you won’t find figures for them here; we would rather say that than fill the page with guesses.
Home Comfort Enterprises (HCE) installs solar panels, battery storage and EV chargers. We are MCS-certified for solar PV and battery storage, with certification held via NAPIT (member 73495), and a HIES Consumer Code member (HCE/A/1392). The detail for the city is on our pages for solar panels in Milton Keynes and battery storage in Milton Keynes.
Quick answer
Solar panels in Buckinghamshire, starting with Milton Keynes:
Figures: PVGIS, Met Office, ONS, National Grid, Energy Networks Association, Energy Saving Trust, HMRC; cited in full below.
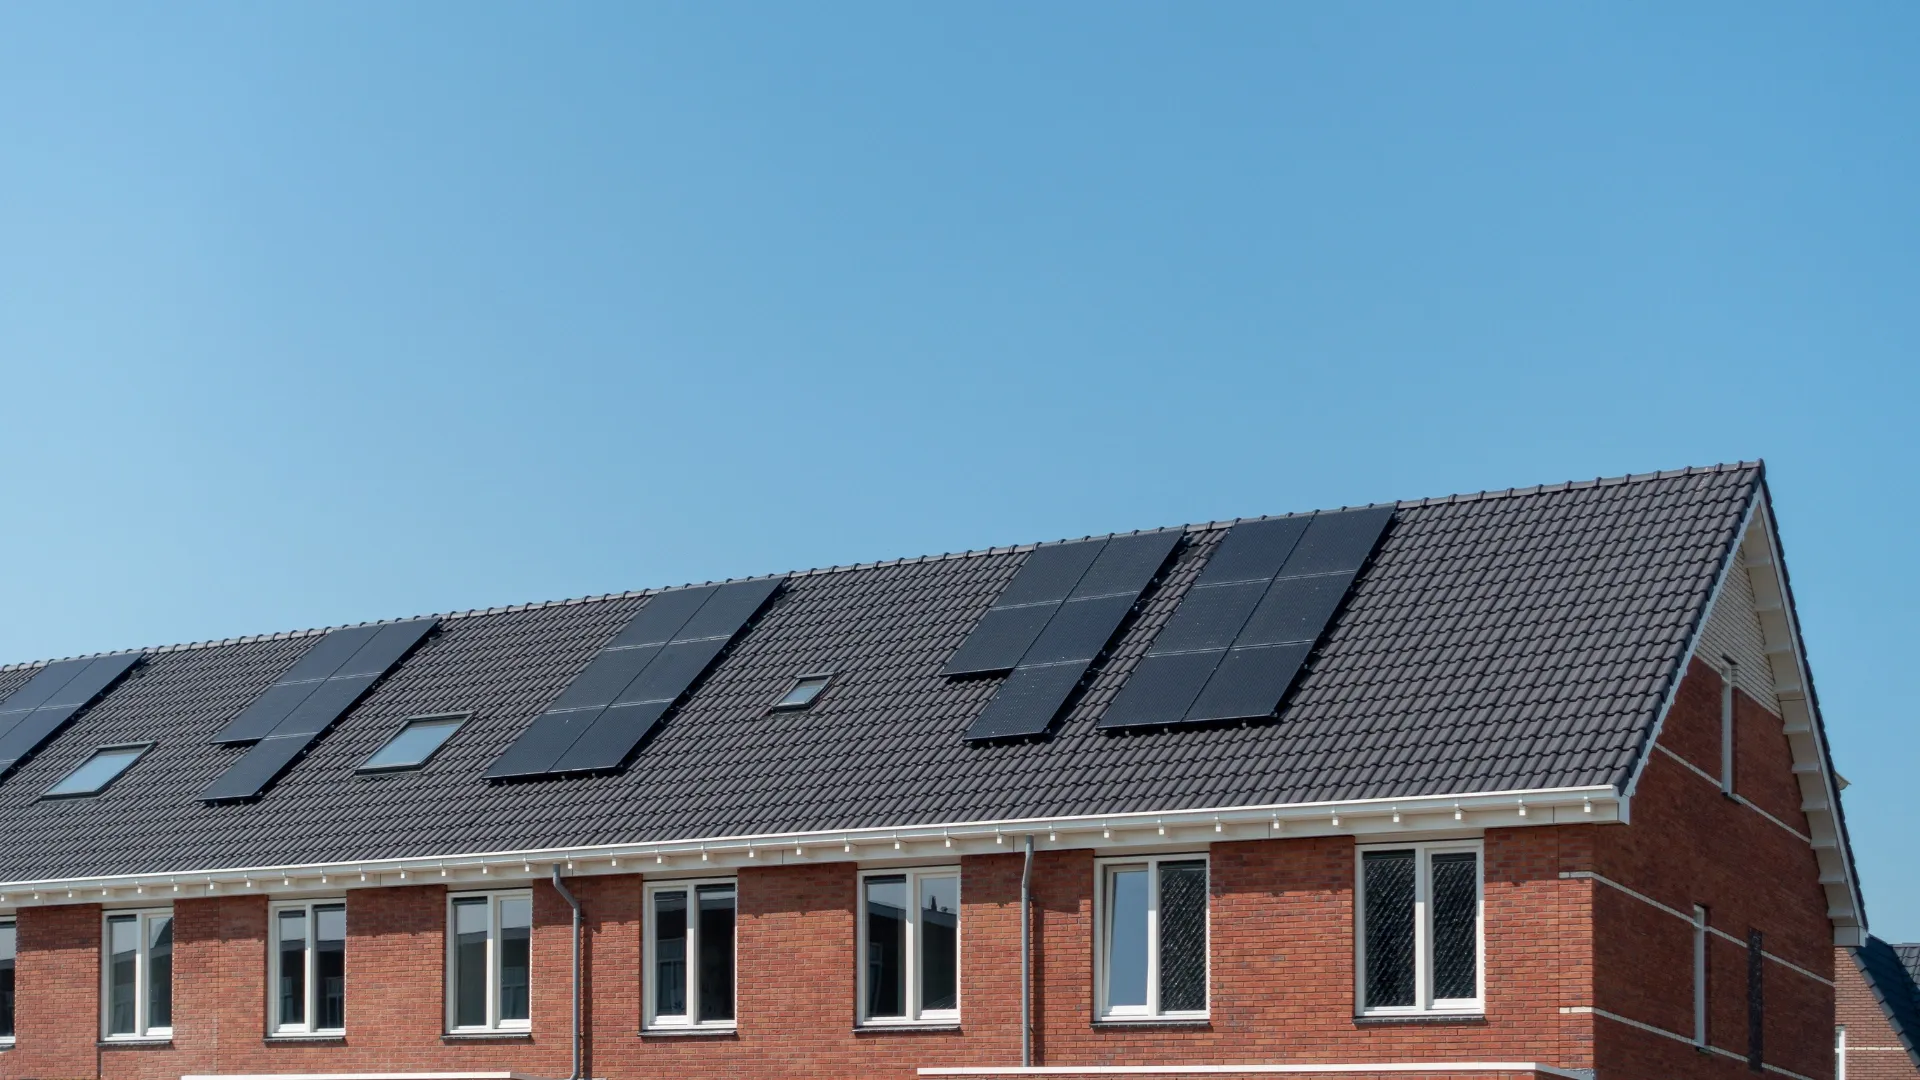
Milton Keynes’ built-up area held 197,340 people at the 2021 Census, and its households split almost evenly by house type: 28.4% detached, 26.5% semi-detached, 24.7% terraced and 20.3% in flats or maisonettes. Most of those houses have a pitched roof of a size that suits a typical array. Tenure is what makes the city unusual. 6.1% of households in the council area, 6,905 of them, live in shared ownership, about six times England’s 1.0% (our arithmetic), and GOV.UK says every shared-ownership home is leasehold. In Milton Keynes the first question is often who controls the roof, not which way it faces.
The houses are also efficient by English standards. The city’s median EPC score is 73, band C, against 69 for England, with detached houses at 72, semis at 71, terraces at 70 and flats at 79. The exception is the older stock: homes built before 1929 score a median of 59, so in Stony Stratford’s or Wolverton’s older streets insulation may belong in the same plan as panels, while in a newer house the case rests on generating, and storing, your own electricity.
Sources: ONS, Towns and cities, characteristics of built-up areas, Census 2021 (tables 1c and 5c) · ONS Census 2021 TS054 Tenure via Nomis · GOV.UK, Shared ownership homes · ONS, Median energy efficiency score, March 2025 edition (tables 1a, 2a to 2c). Read 15 October 2026.
Milton Keynes Council’s three political groups agreed a climate emergency in 2019. The refreshed Sustainability Strategy works towards net zero for the city, and for the council’s own activities, by 2030; it will be reviewed in 2028 and sits alongside a five-year Pathway to Net Zero 2030 plan for the council’s own emissions.
The council is candid that its own share is small: around 4% of the city’s greenhouse gas emissions. It says it has cut those by 35%, has switched 98% of the city’s streetlights to LED and has reduced energy use in council buildings by 80%. The rest of the city’s emissions come from everyone else, households included, and that is where a roof, a battery and an EV charger come in.
Sources: Milton Keynes City Council, Our Net Zero journey · Milton Keynes City Council news, City Council is leading the way to net zero (2025). Read 15 October 2026.
PVGIS 5.3, run 15 October 2026
One system, central Milton Keynes: 4 kWp, 35° tilt, due south, 14% system losses, building-mounted.
| About kWh (4 kWp) | About kWh a day (our arithmetic) | |
|---|---|---|
| June | 474 | 15.8 |
| July | 479 | 15.5 |
| December | 136 | 4.4 |
| January | 156 | 5.0 |
| Whole year | 3,942 | 10.8 |
PVGIS puts the year at about 3,942 kWh, give or take about ±161 kWh from one year to the next, well above Ofgem’s typical household use of 2,500 kWh a year from 1 July 2026. The months tell the more useful story. December’s output is about 29% of June’s (our arithmetic), and at about 4.4 kWh a day it is below what a typical household uses. That is why we size a battery to your evenings, not to June, and why nobody should promise you winter self-sufficiency.
The nearest Met Office climate station, at Woburn, about seven miles east of the city centre, averaged about 1,509 hours of sunshine a year over 1991–2020, above the UK’s 1,403; July is its sunniest month at about 198 hours and December its dullest at about 48. The figures assume an unshaded roof facing due south at 35°. An east- or west-facing slope makes less, and shading changes the answer more than the city does, so we survey before we quote.
Sources: PVGIS 5.3 (European Commission Joint Research Centre), run for central Milton Keynes on 15 October 2026 (monthly and annual) · Ofgem, typical domestic consumption values from 1 July 2026 · Met Office, Woburn location-specific long-term averages, 1991–2020. Daily and percentage figures are our arithmetic.
Local facts, sourced
Council-area figures from named public sources. Where we have done the arithmetic, we say so.
DESNZ records about 8,802 solar PV installations of every size, rooftop to solar farm, across the Milton Keynes council area, with 82.26 MW of capacity, at the end of 2025, as first published. It is not a count of homes.
Source: Department for Energy Security and Net Zero, Renewable electricity by local authority 2014 to 2025 (published 29 September 2026)
DVLA records about 10,047 privately kept plug-in vehicles across the Milton Keynes council area at the end of June 2026, up from about 6,924 a year earlier, a rise of about 45% (our arithmetic). About 93% of the area’s plug-in vehicles are registered to company keepers at a company address, so the household figure is the privately kept one.
Source: Department for Transport and DVLA, VEH0142 licensed plug-in vehicles by local authority (published 23 September 2026), notes 5 and 6 on keeper postcode
6.1% of households in the Milton Keynes council area, 6,905 of them, live in shared ownership, against 1.0% across England; 54.8% own outright or with a mortgage, 20.9% rent privately and 18.1% rent socially.
Source: ONS Census 2021, TS054 Tenure via Nomis (Milton Keynes E06000042; England E92000001)
Milton Keynes’ median EPC score is 73, band C and four points above England’s 69. Homes built before 1929 are the exception, at a median of 59.
Source: ONS, Median energy efficiency score, England and Wales, up to financial year ending March 2025, tables 1a, 2a, 2b and 2c
Milton Keynes has 27 conservation areas, among them Bletchley, Bradwell, Great Linford, Shenley Church End, Stony Stratford and Wolverton, and the council is reviewing all 27.
Source: Milton Keynes City Council, Conservation areas in Milton Keynes; planning.data.gov.uk conservation-area dataset
Milton Keynes City Council says it produces around 4% of the city’s greenhouse gas emissions, has cut its own by 35%, has switched 98% of the city’s streetlights to LED and has reduced energy use in council buildings by 80%.
Source: Milton Keynes City Council news, City Council is leading the way to net zero (2025)
DESNZ estimates about 9.5% of homes in the Milton Keynes council area have no mains gas connection (2024).
Source: Department for Energy Security and Net Zero, Subnational estimates of properties not connected to the gas network 2015 to 2024 (published 18 December 2025)
Data last reviewed: 15 October 2026
The Energy Saving Trust’s national anchor is a typical 4.5 kWp system, around 12 panels, at around £7,600 installed: a UK figure, not a Milton Keynes price. For storage, it puts a 5 kWh battery at around £4,600 and says fitting one at the same time as panels should cost less than a separate visit later. Installations carry 0% VAT until 31 March 2027, then 5% from 1 April 2027, batteries included. Exported surplus earns Smart Export Guarantee payments at rates each supplier sets and can change, which is why we never print one.
Two Milton Keynes costs are worth settling before any quote: your shared-ownership provider’s consent, if you have a lease, and whether an older house needs insulation first. More on solar panel installation costs, how long panels take to pay for themselves and what size home battery you need.
Sources: Energy Saving Trust, Solar panels: costs, savings and benefits explained (updated 27 August 2026) · Energy Saving Trust, Battery storage (updated 19 August 2026) · HMRC VAT Notice 708/6 · Ofgem, Smart Export Guarantee.
Milton Keynes is a member of the Portsmouth-led consortium that GOV.UK lists with £34,807,254 of Warm Homes: Local Grant funding. On 15 October 2026 the city council’s page said formal applications were not open, but residents could check eligibility and register interest through Warmer Homes. GOV.UK’s test is a privately owned home, rated EPC D to G, and usually a household income of £36,000 or less. The EPC part of that test matters here: the city’s median home scores 73, band C.
Group buying is quiet too. Switch Together, the scheme formerly known as Solar Together, has a Milton Keynes page, but on 15 October 2026 it said the scheme was not active in the area and invited residents to register interest. Neither route is a general grant for solar, and we don’t run or arrange either; for most owner-occupiers the decision rests on a survey and an itemised quote.
Sources: GOV.UK, Warm Homes: Local Grant successful local authorities (updated 2 July 2026) · GOV.UK, Apply for the Warm Homes: Local Grant · Milton Keynes City Council, Warm Homes: Local Grant · Switch Together, Milton Keynes page. Read 15 October 2026.
Milton Keynes has 27 conservation areas, from Bletchley, Bradwell and Great Linford to Shenley Church End, Stony Stratford and Wolverton, and the council is reviewing all 27. Under Part 14 Class A of the permitted development order, as amended from 27 August 2026, a conservation area only excludes panels on a wall, balcony or roof enclosure fronting a highway. Roof slopes, front ones included, stay permitted development if the panels sit no more than 0.2 m proud and no higher than the highest part of the roof; a flat-roof array there needs a prior-approval determination first, and a listed building always needs consent.
Two places have Article 4 directions. The council’s summary of the Wolverton direction covers alterations to elevations fronting a road, hard surfaces, walls and front satellite dishes, and does not mention solar; Olney has its own direction. A summary is not the full text, so we check the direction for your street before quoting. On a shared-ownership home, the lease is a separate consent from planning, and usually the first one to ask about.
Sources: Milton Keynes City Council, Conservation areas in Milton Keynes and Article 4 Directions in Milton Keynes · planning.data.gov.uk conservation-area dataset · legislation.gov.uk, GPDO 2015 Schedule 2 Part 14, as amended by S.I. 2026/896. Read 15 October 2026.
Unlike our Hertfordshire, Essex and Bedfordshire pages, central Milton Keynes is not on UK Power Networks. A 2018 National Grid planning response on the council’s website names Western Power Distribution as the city’s electricity distribution operator, and WPD was renamed National Grid from 21 September 2022; on NESO’s boundaries the city centre sits in National Grid Electricity Distribution’s East Midlands licence area, with UKPN’s Eastern area about 7 km away. For an address towards the edge of the city, the Distributor ID on your bill settles it: 11 is East Midlands, 10 is Eastern England.
The connection rules are national. A system up to 16 A per phase (3.68 kW) is notified under G98, before commissioning or within 28 days after; anything larger needs a G99 application approved before work starts, and your installer handles it. Ofgem’s 2024/25 figures for the East Midlands area, as reported, show about 34.3 supply interruptions per 100 customers and about 24.6 minutes lost per customer over the year, against 39.7 and 35.1 across all fourteen GB licence areas. A standard grid-tied battery shuts down in a power cut unless the system is designed for backup.
Sources: Milton Keynes City Council, National Grid representation (Ravenstone Neighbourhood Plan, 10 August 2018) · National Grid, Western Power Distribution and National Grid FAQs · NESO, GIS boundaries for GB DNO licence areas · UK Power Networks, licence boundaries open data · Energy Networks Association, Find my network operator · ENA EREC G98/G99 · Ofgem, RIIO-2 Electricity Distribution annual report 2024 to 2025. Read 15 October 2026.
If your home is shared ownership and the provider says no, that is the answer, however good the roof. If you rent, privately or from a social landlord, the roof is your landlord’s decision. If your best slope is heavily shaded or faces north, the figures above won’t apply, and we’ll say so. And if you might qualify for the Warm Homes: Local Grant once applications open, check that route before paying for anything.
If the house is empty all day, much of what a 4 kWp array makes would be exported at a supplier-set rate; a battery or an EV charger can change that sum, and we’ll show you the arithmetic rather than a promise. The battery systems in our own job photos are EnSmart and Hanchu.
Bletchley, Wolverton, Stony Stratford or a newer grid square: one survey of your roof and usage, one written, itemised quote, and a straight answer if your lease or your roof says no.
Not yet, and we would rather say so. Our Buckinghamshire coverage is currently Milton Keynes: one city page for solar and one for battery storage, each with its own census, planning and network figures. We have not researched the county’s other towns to the same standard, so this page prints no figures for them. If you live elsewhere in the county, ring or use the form and we will tell you honestly whether we can help.
Possibly, but the lease comes first. 6.1% of households in the Milton Keynes council area, 6,905 of them, live in shared ownership, against 1.0% across England, and GOV.UK says all shared-ownership homes are leasehold. Your lease, and usually your housing provider’s written consent, decides whether panels or a battery can be fixed to the building, so ask before you book a survey. If the provider agrees, the roof is assessed like any other.
For a pitched roof, rarely. Under Part 14 Class A of the permitted development order as amended from 27 August 2026, a conservation area only excludes panels on a wall, balcony or roof enclosure fronting a highway; roof slopes, front ones included, stay permitted development if the panels sit no more than 0.2 m proud and no higher than the highest part of the roof. A flat-roof array in a conservation area needs a prior-approval determination first, and a listed building needs consent. Wolverton and Olney have Article 4 directions; the council’s summary of Wolverton’s does not mention solar, but we check your street before quoting.
For central Milton Keynes, National Grid Electricity Distribution’s East Midlands area. A 2018 National Grid planning response on the council’s website names Western Power Distribution as the operator, and WPD was renamed National Grid from 21 September 2022; UK Power Networks’ own licence data does not place the city centre in any of its areas. UKPN’s Eastern area is about 7 km from the city-centre point, so for an address towards the edge of the city check the Distributor ID on your bill: 11 is East Midlands, 10 is Eastern England. Systems up to 16 A per phase are notified under G98; larger ones need G99 approval before work starts.
There is no general government grant for household solar. Milton Keynes is in the Portsmouth-led Warm Homes: Local Grant consortium, but on 15 October 2026 the city council said formal applications were not open; residents could check eligibility and register interest through Warmer Homes. The grant is for privately owned homes rated EPC D to G, usually with household income of £36,000 or less. Switch Together, formerly Solar Together, said the same day that it was not active in Milton Keynes. We don’t run or arrange either.
Where we cover
For now, Milton Keynes: its page carries the city’s own census housing figures, conservation areas, council schemes and network details, with every source named.
Tell us your area of the city, and whether your home is shared ownership, leasehold or rented, and we’ll arrange a survey and a written, itemised quote, with no obligation. Ring HCE on 0204 547 1892 or use the form.
For a longer read, see Plug-in cars in Milton Keynes: where solar and a battery fit.
Also see: Bedfordshire · Hertfordshire · north London